Azure
Application Inisghts
Introduction
Capturing error information is an important requirement. Sitefinity puts these into log files by default but that is not so handy when you have to navigate to the server to get them. Worst when you are in a load balanced environment. Elmah is an option but has its downside. You can craft your own or you can use a little Sitefinity secert.
Lets summerise those options
Log Files - Fine locally for debugging but trolling through a day's logs looking for an error that happened is hardly fun. Worse when that error could be on one of three servers.
Elmah - Nice, it pushes all errors to an Elmah database and provides a simple web page to look at them. Put it pushes every Sitefinity event, info, warnings, etc and they are all classed as 'Errors'. I think to make it work that everything gets wrapped in a new Exception error which is thrown and that is a lot of resource overhead. (Could be completely wrong there.)
Outsource - A better option. Have a third party like Splunk access those files and suck them into its system for viewing. Or write your own Trace Listener that does the same as Elmah capturing and sending the errors to a system of your choice. (Sitefinity has an example of that using RayGun.)
If you use Azure then you probably are also using Application Insights. Using the Trace Listener example from Sitefinity I originally created my own listener to push errors to my Application Insights service. It was OK but seemed to miss some stuff. I could never put my finger on it.
Today you may have heard that Sitefinity will now host your Sitefinity site in Azure for you. I was on an initial demo/training for this and while checking out the project I noticed some code and that lead me to find a new package. Progress.Sitefinity.AppInsights. To provide the monitoring services in Azure the Sitefinity team have created an actual plugin. I added it to my project and it worked fantastically.
Beaware, if you use this plugin it is unlikely Sitefinity will provide you support for it. It is not an offical part of Sitefinity so you will be on your own with it. Be prepared to uninstall it if you have major issues so that they can determine that it is not a causing factor.
Steps to deploy
The first part is easy, add the package via NuGet. It will also install half a dozen Application Insight dependency packages. Accept these and wait for it to finish.
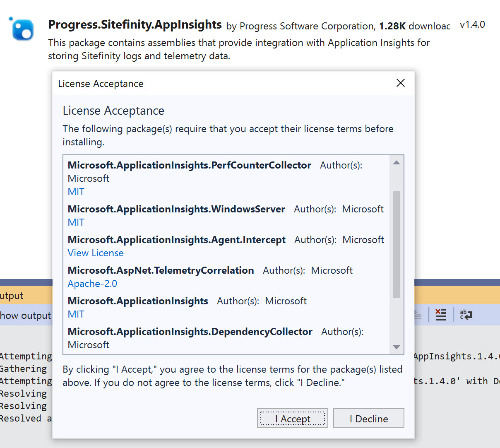
Next I upgrade those Microsoft packages to their latest version. This upgrade is up to you of course.
Build and run your project. You may get an error
An ASP.NET setting has been detected that does not apply in Integrated managed pipeline mode.
This application defines configuration in the system.web/HTTPmodules section.
The installation has added some modules into your web.config file under the
Wire up to Azure Application Insights
You have everything installed but before it will work you need to add your API key. Go to your Application Insights instance where you will find the instrumentation key. In your project, you will find a file, ApplicationInsights.config.
Open this and at the top, you will find an empty element called 'InstrumentationKey
BUT... Leave it blank. You don't want data from your local dev or test environments flowing into your production logs. You may want to set up a test instance and you can 'categorise' different sources in the one instance of AppIns and you can look up the Azure documentation on about doing that. If you leave it blank, then no data is sent.
It is good to keep in mind, the more data you record the more you pay. You can set a cap such as 50MB per day max.
For production, if you are using Azure you can add a configuration key APPINSIGHTS_INSTRUMENTATIONKEY and Azure will automatically use that key. Otherwise, you can look to have your deployments inject that key.
But Wait There's More
Not only do you get full instrumentation of your server performance and application integration with Sitefinity, but you can also add client-side monitoring, absolutely free. By adding some JavaScript to you pages, just like Google Analytics, you can start logging JavaScript performance and errors.
<script>
    var appInsights = window.appInsights || function (a) {
        function b(a) { .....
    }({
        instrumentationKey: "{your key here}"
    });

    window.appInsights = appInsights, appInsights.queue && 0 === appInsights.queue.length && appInsights.trackPageView();
</script>
What I would also suggest here is to wrap this code in an 'if' statement. If the page is not 'backend' and is the production environment then render this script. Again you don't want this running and logging data in places you don't want.
You can find this script snippet in your Application insights under the quick start link and in the documentation. You copy it and put it in the head of every page you want to monitor replacing the instrumentation key with your value.
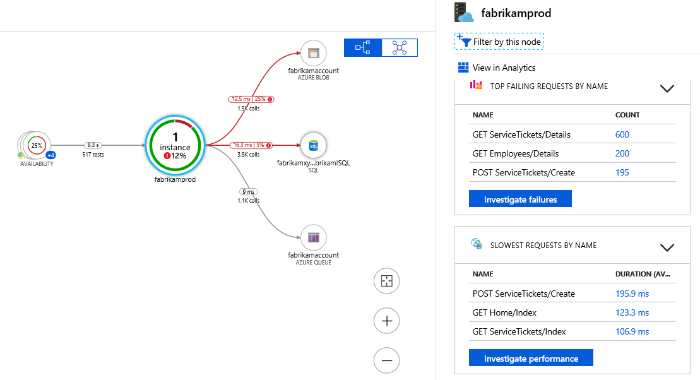
What we end up with
What we end up with is all the bells and whistles of Application Insights. Performance and error summaries, drilling down into request. Tracking calls from the client-side to the server, to the database. I will leave you to investigate the service in detail. I find it really helpful. Just a few weeks ago, I deployed an update then found one page and widget throwing an error. Using App Insights I found the issue in 5 minutes. If I was forced to pull down logs and troll through them it would have been so much longer.

Thanks for reading and feel free to comment - Darrin Robertson
If I was really helpful and you would buy me a coffee if you could, yay! You can.
Leave a comment Load more commentsMake a Comment